Summer 2026
We've been quiet. Here's what we were doing.
Over the last year we rebuilt almost every part of how Media Proper operates, and told almost nobody. This page is the whole story.
How websites get made
Six weeks is now six days.
This is the big one. We reorganized our design and development process around AI, specifically around our own custom build tool and AI systems. A website build that used to take six-plus weeks now takes about six days.
That is not corner-cutting. The sites are better. Faster load times, cleaner code, better accessibility, SEO fundamentals baked in from the first commit.
We want to be straight about AI, because transparency matters more than mystique.
What AI changed: code development, build scaffolding, component architecture, refactoring, testing, performance work, and the tedious middle 50% of a build.
What AI did not touch: design, information architecture, understanding your business, and working out what your site actually needs to do. Those still take human judgment and human hours. We have not automated a minute of them.
AI did not replace the craft. It got rid of the grind that used to crowd the craft out.
We used it on our own website first.
We did not pilot this on a client. Before our new tools went near work you're paying for, we rebuilt mediaproper.com with them. If it was going to break something, better our site than yours.
Same tooling, same six-day clock. Here's what came out:
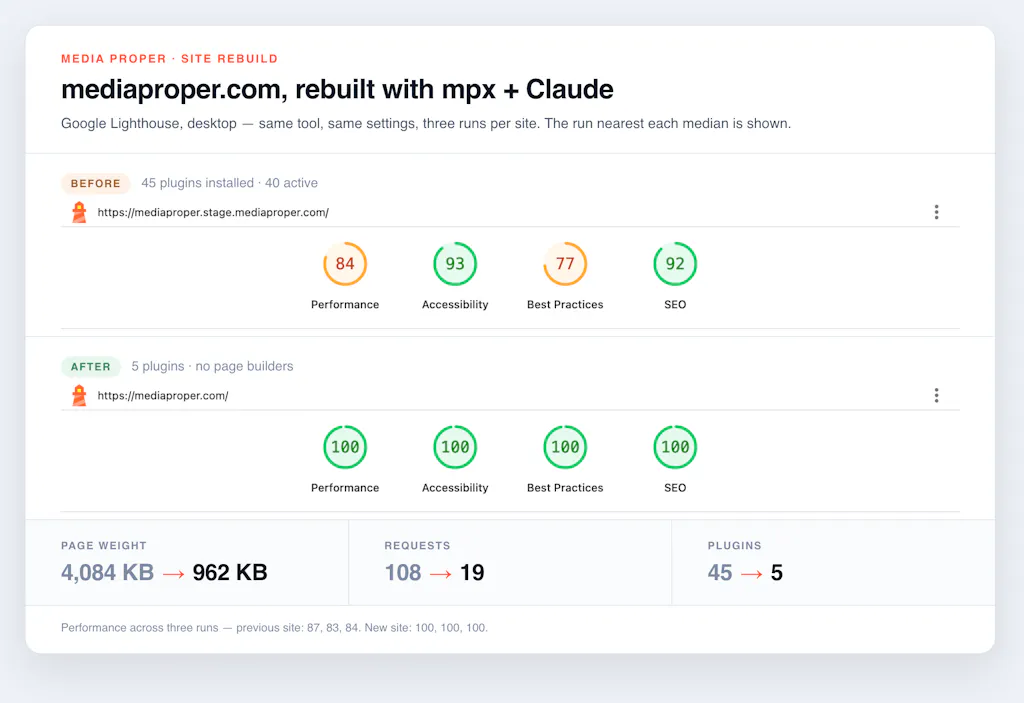
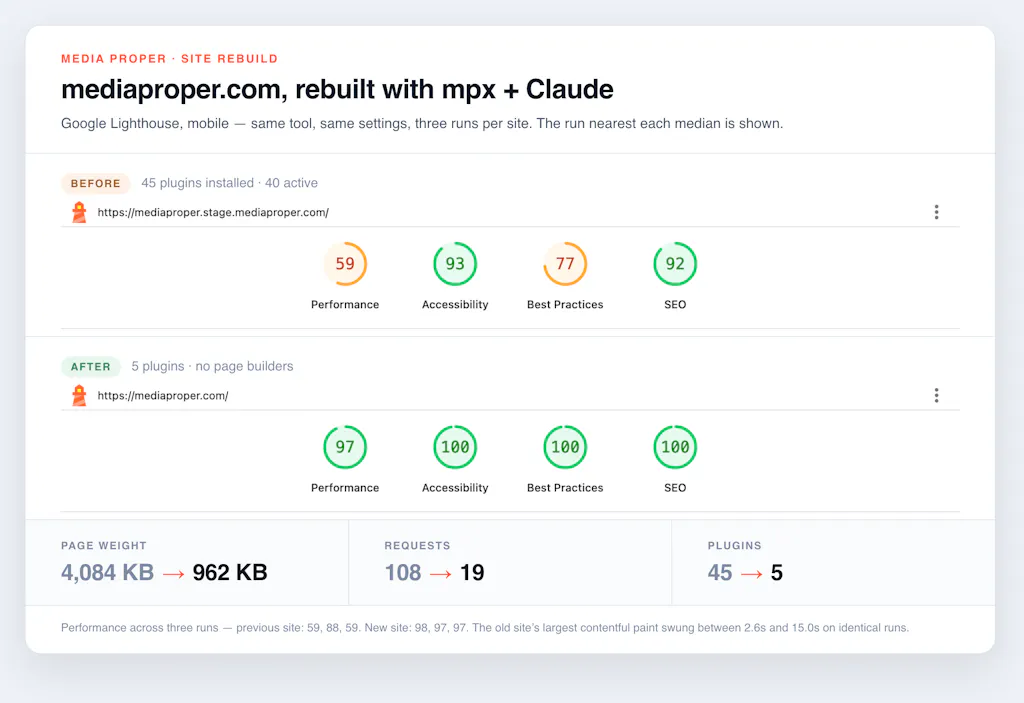
- Plugins: 40 down to 5. No page builders at all.
- Page weight: 4,084 KB down to 962 KB. About a quarter of the data.
- Requests: 108 down to 19.
- Lighthouse, Google's website performance audit: 84 to a straight 100 on desktop. Mobile went 59 to 97.
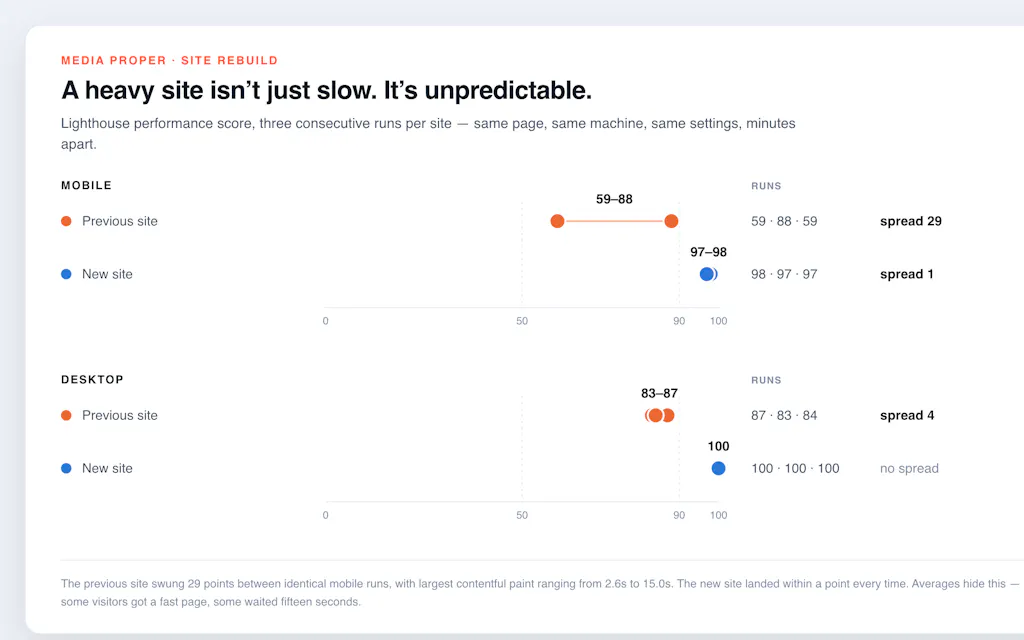
One thing surprised us. We ran each site three times. The new one landed within a point of itself every run: 97, 98, 97 on mobile. The old one swung 59, 88, 59, and its main content took anywhere from 2.6 to 15 seconds to appear. Same page, minutes apart.
Slow is one problem. Unpredictable is worse. Some of your visitors have a fine time, some wait fifteen seconds, and an average hides it.
You can check it for yourself. This is that site.
Analytics
Hundreds of live data connections. Dozens of client dashboards.
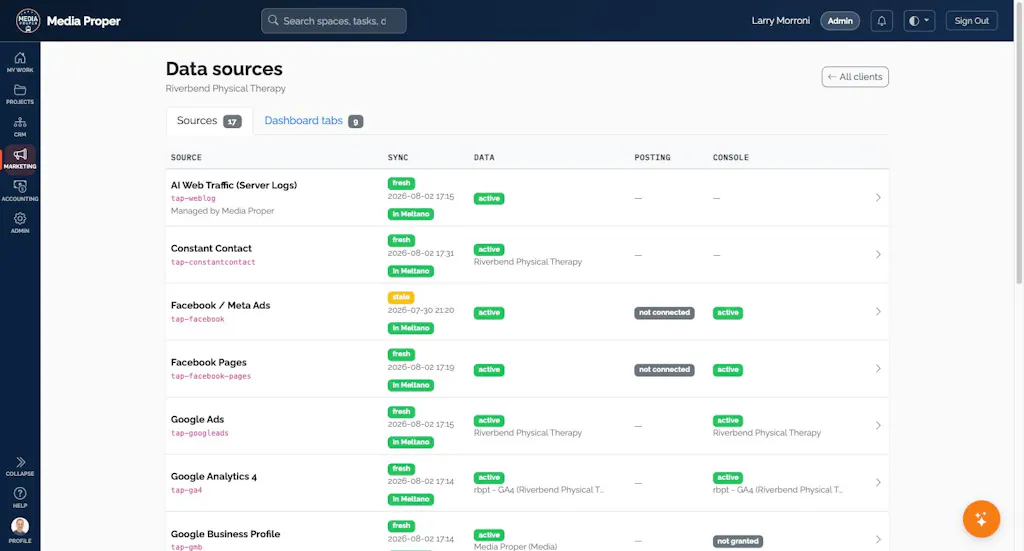
We stopped renting our analytics stack and built one. We warehouse client data ourselves, pulling from Google Analytics, Search Console, Google Ads, Meta Ads, Facebook, Instagram, LinkedIn, Google Business Profile, Mailchimp, Constant Contact and more into one place, with a dashboard built per client. Right now that is hundreds of live data connections feeding dozens of client dashboards.
What a dashboard includes.
Every dashboard is built for one business, so no two are identical. What follows is what a full one carries.
Sources we connect. Each becomes its own tab, and each is a live connection rather than a monthly export:
- Google Analytics 4 and Search Console
- Google Ads and Meta Ads
- Facebook, Instagram and LinkedIn pages
- Google Business Profile
- Mailchimp and Constant Contact
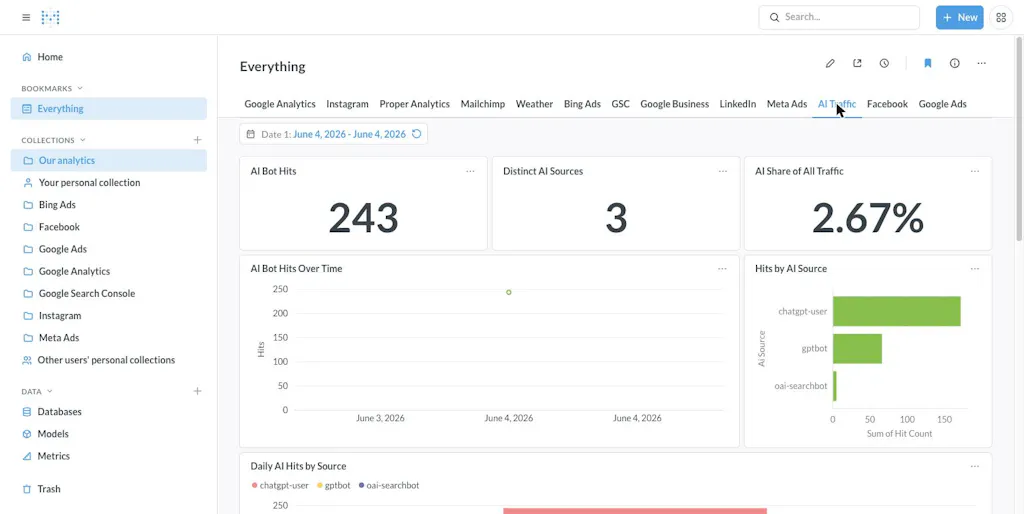
- AI Traffic, read straight from your server logs. This one only exists if you host with us, and Google Analytics cannot see it.
What you get on top of the data. Connecting sources is the easy half. These are the parts that make it worth opening:
- Month-over-month and year-over-year comparison on every headline number, so a good month is visibly a good month and not just a big one.
- A tab per channel, so you can answer "what did paid actually do" without exporting anything.
- Cross-channel questions that are impossible when your data lives in nine separate logins. Did the email campaign move organic search? Did paid spend change direct traffic?
- Your monthly written briefing, embedded in the dashboard alongside the charts it refers to.
- Logins for your whole team. It is your dashboard, not a report we email you.
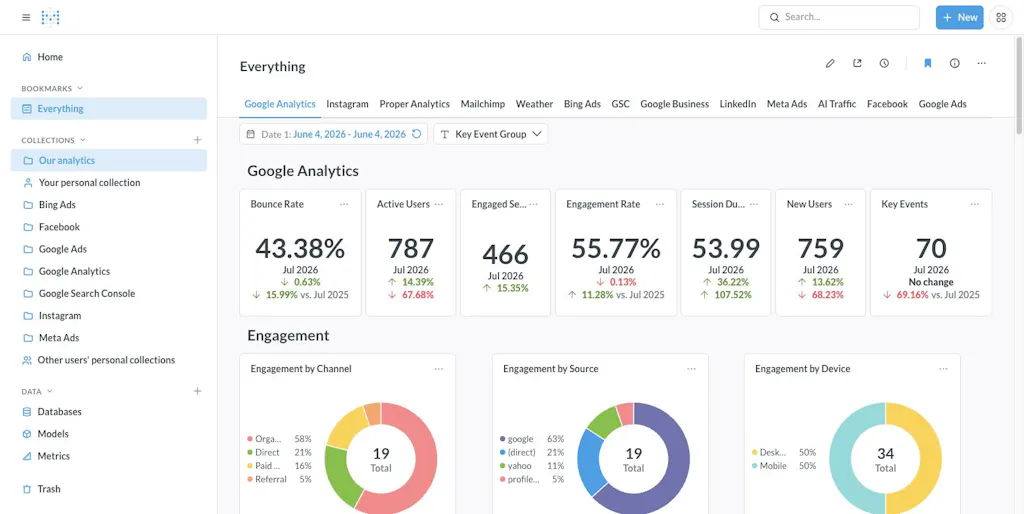
Live, all month. Not a PDF that lands on the tenth and gets filed.
Monthly AI briefings
A written analysis. Every month. Automatically.
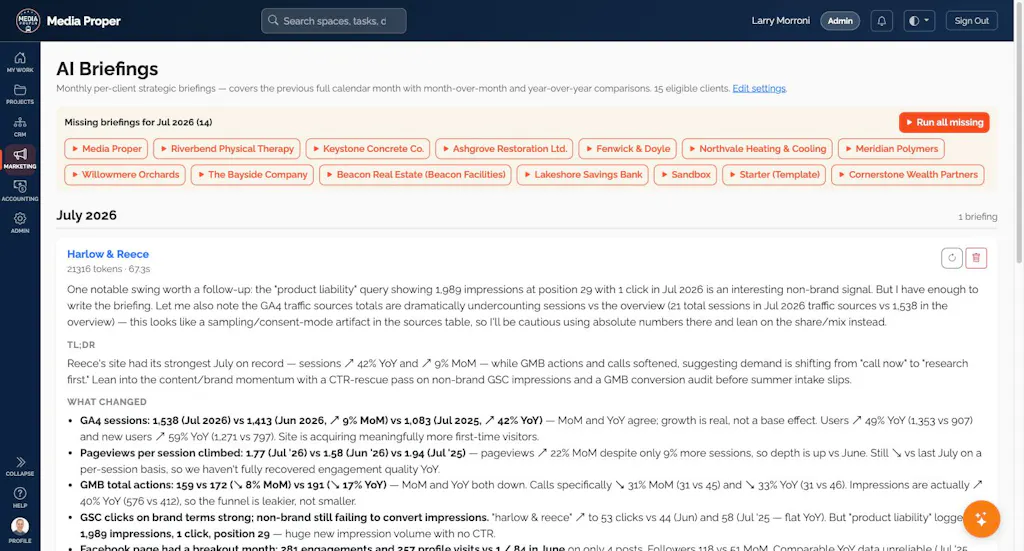
Every month, every dashboard client gets a written strategic briefing. It compares this month to last month and to the same month a year ago, flags what actually changed, separates real growth from noise, and recommends what to do next. There is a TL;DR at the top. It is not a chart dump. This used to cost an analyst-day per client, which in practice meant it only happened for the biggest accounts. Now it can happen for more accounts.
Read a sample.
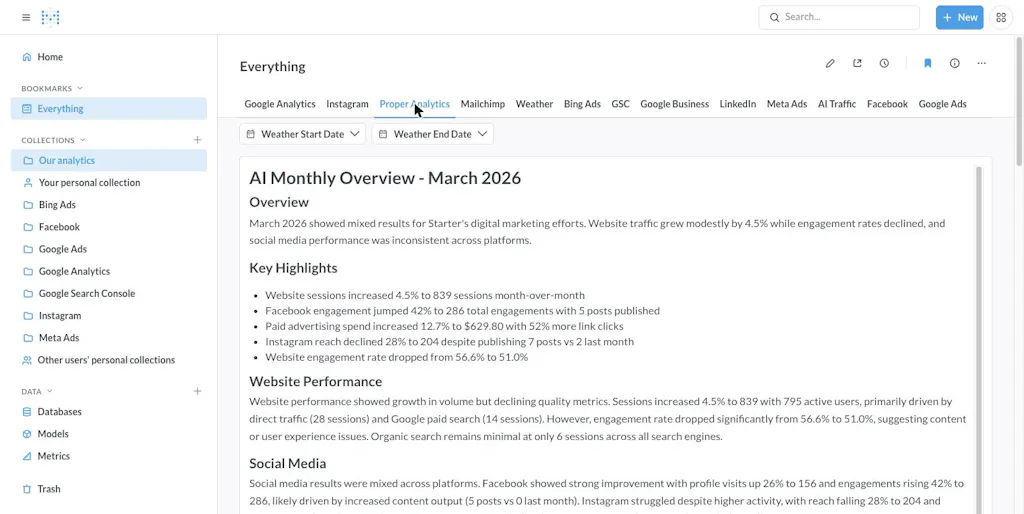
This is a real briefing, trimmed to fit. The numbers are from our own demo account rather than a client's, and the shape is exactly what lands in your dashboard on the first of the month.
TL;DR. Traffic grew 4.5% month over month to 839 sessions, but engagement fell from 56.6% to 51.0%. Facebook is working. Instagram is not. Organic search is still almost nonexistent.
What changed.
- Sessions up 4.5% to 839, with 795 active users. Most of the lift came from direct traffic and paid search, not organic.
- Facebook engagement up 42% to 286 across 5 posts. Instagram reach down 28% to 204, despite 7 posts. More effort, less return.
- Paid spend up 12.7% to $629.80, with 52% more link clicks. The spend is working harder than it was.
- Organic search delivered 6 sessions across all search engines. That is the real story this month.
What to do next. Organic is the gap, and six sessions a month is a content problem rather than a ranking tweak. Move the Instagram effort into Facebook where the audience is responding, and spend the recovered time on two pages targeting the queries paid search has already proven convert.
That is the whole thing. No chart dump, no jargon, and a human reads every one before it goes out.
AI traffic
We can see the traffic Google Analytics cannot.
If your site is hosted with us, we read your raw server logs, which means we can see AI crawlers and AI-referred traffic hitting your site. Google Analytics cannot see most of it. As more of your customers start their search inside an AI assistant instead of a search box, this becomes one of the most important signals in digital marketing, and most agencies have no way to measure it. Hosted elsewhere and want this? Talk to us about moving.
Our app
We built our own app. All of it.
For years we ran on other people's software and bent our process to fit their assumptions. Then we paid monthly for the privilege. So we built our own: project management, CRM, helpdesk, time tracking, accounting, email marketing, social publishing, and the analytics dashboards, all in one system, all talking to each other. All of it saving us the overhead of time wasted on things besides our client work.
- 4,340 support tickets handled, 4,155 resolved.
- Median time to resolution: 17.5 hours.
- 200+ people in our client-facing helpdesk, including many of you.
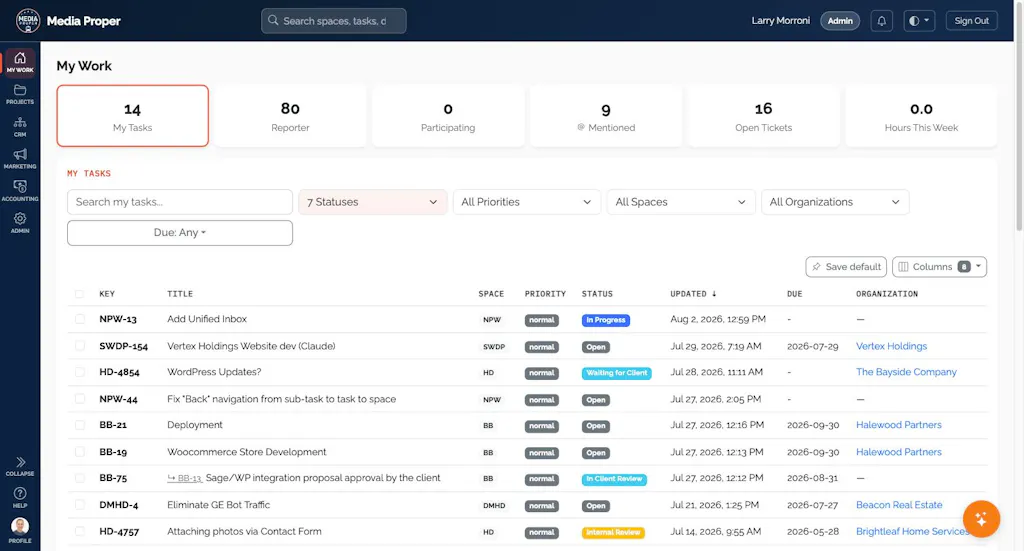
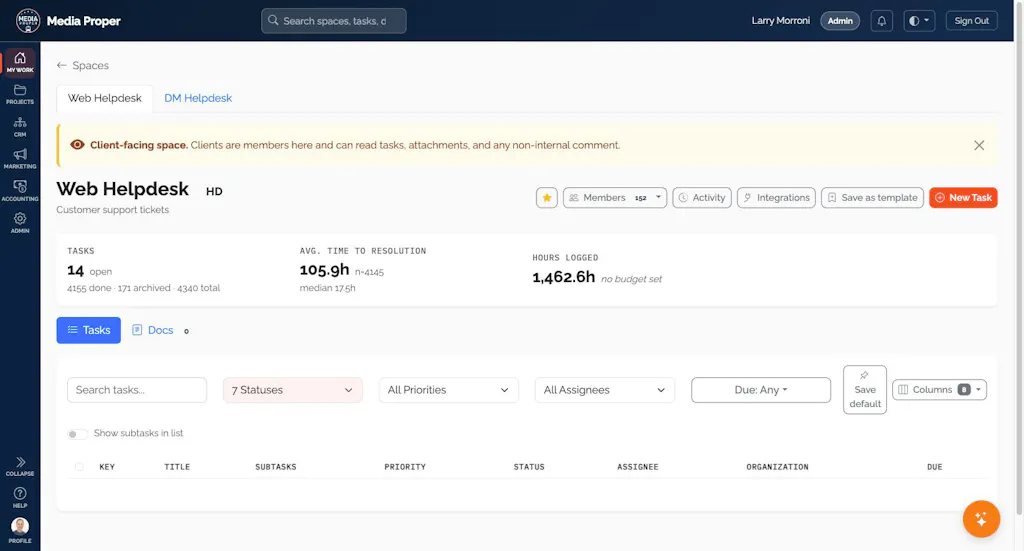
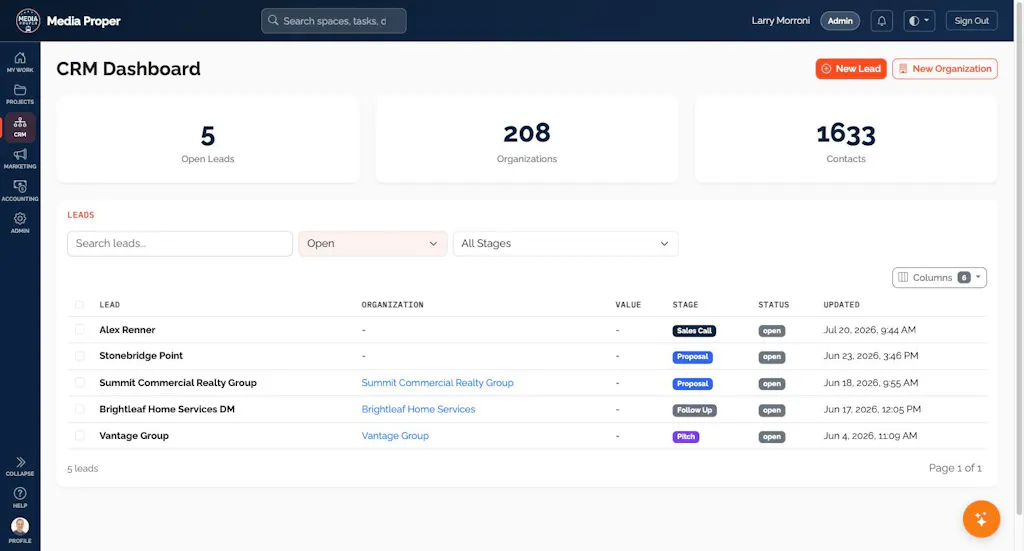
The part that matters to you is not the feature list. When you ask for something, or a staff member spots a problem, we build and ship the fix in days instead of weeks. And because we own it, when our process needs to change we change the software instead of the process.
The office
We bought a building and swung hammers.
We purchased 20 W. 3rd Street in Media, gutted it, and moved in. We did a lot of it ourselves: demolition, electrical, flooring, painting, some carpentry, and some of the finish work. It was exhausting and we would do it again. We even had our kids and their friends helping. The part we are proud of is who else was on the job. Wherever we could, we hired our own clients' businesses to do the work. That was not a marketing decision. It is how we like to operate. We would rather work with people we know and trust. This building got built by a network we are part of. Come see it. Reply and we will get you in for a coffee.
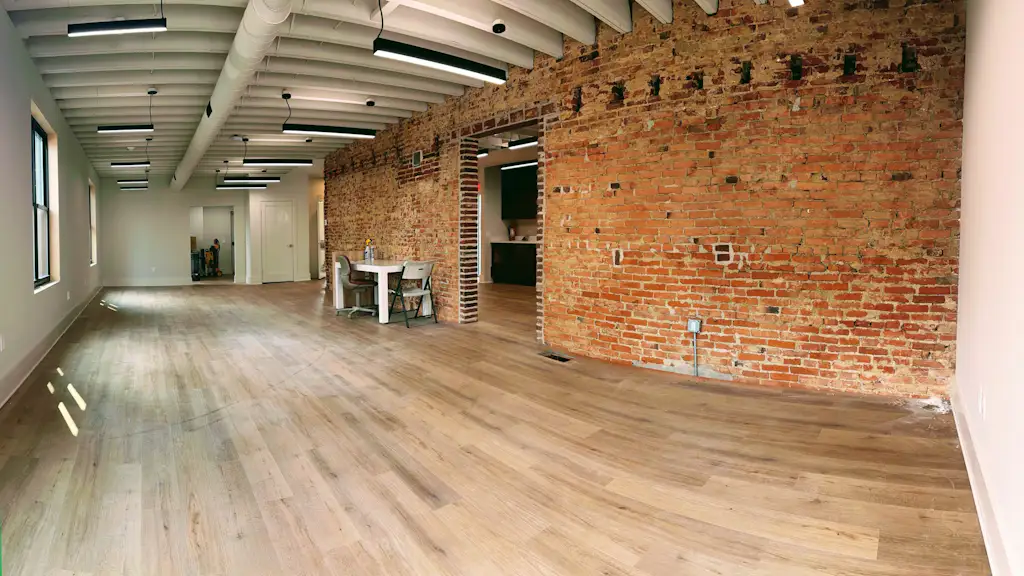
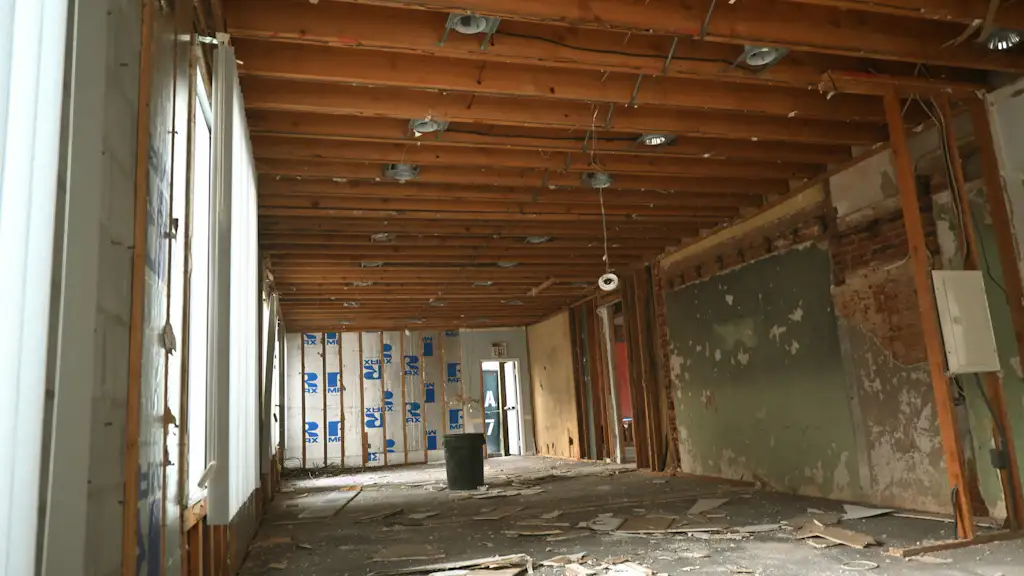
Same corner, about a year apart. Drag to compare.
Nothing changes unless you want it to.
But a few of you will read this and realize we now do something you did not know we did. If that is you:
None of this got rebuilt for its own sake. We rebuilt it so our time goes to where it matters most: growing your business.
Every one goes to a monitored inbox.